

ONE REGION. FOUR MAIN MARKETS. FIFTEEN SUB-MARKETS. AND NOT ONE EARNED A HOT RATING.
One region. Four main markets. Fifteen sub-markets. And not one earned a HOT rating in September.
Last month, Riverview East was the only HOT pocket in Greater Moncton. This month it sold eight homes, slipped under my 10-sale cutoff, and took the region's last HOT rating with it. A few of the tighter pockets are still tight on paper. They just didn't sell enough homes this month to earn a rating.
Here's the number that puts September into perspective: Greater Moncton sold 229 homes. That's the fewest September sales in the entire stretch this report tracks, all the way back to 2016. In the same month, 472 new listings hit the market, the most for any September in that same stretch.
Fewest sales. Most new listings. Same thirty days.
And the median price still went up.
Hang on to that last part. It's why one headline number never tells the whole story.
QUICK KEY BEFORE YOU SCROLL:
HOT: Sellers are firmly in control. Buyers need to come prepared.
WARM: Still favours sellers, but buyers can breathe.
BALANCED: Pretty much a fair fight.
COOLING: Buyers are gaining leverage.
COLD: Buyers are holding most of the cards.
TOO SMALL TO RATE: Fewer than 10 sales. Rating a neighbourhood off four transactions is astrology with a spreadsheet.
Ratings weigh inventory, sales activity, selling time and sale-to-list ratios together, so two areas with the same months of inventory can land on different ratings.
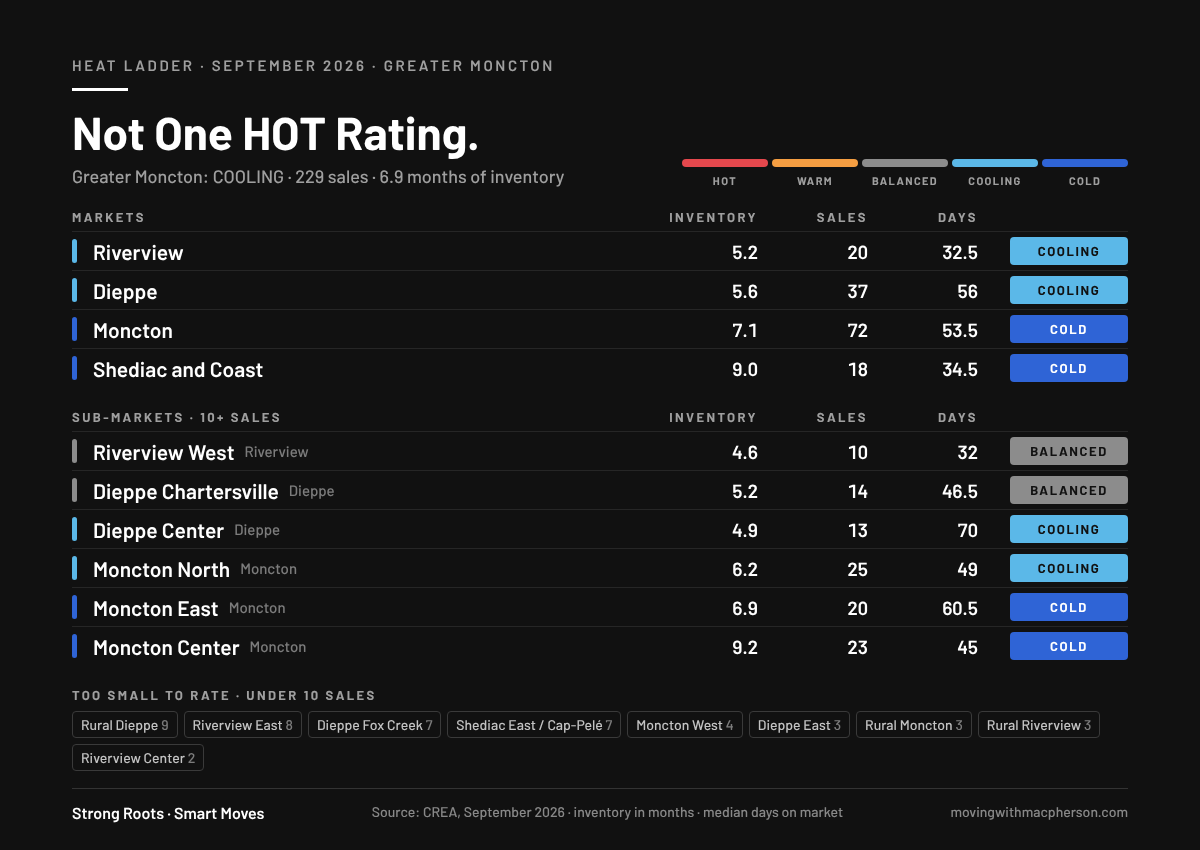
GREATER MONCTON: COOLING
229 sales | $367,626 average | $360,000 median | 6.9 months of inventory | 51 days on market
Sales fell 26.1% from last September. Active listings climbed to 1,575, up 8.7%. Months of inventory hit 6.9, up from 4.7 a year ago and 6.2 in last month's report. You have to go back to 2018 to find a September with more months of inventory than that.
Now the prices. Average price fell 3.3%. Median price rose 1.1%. The MLS® Home Price Index benchmark sits at $377,400, up 0.4% from a year ago, down 0.3% from last month, and down 6.3% from six months ago.
So is Moncton crashing? Sales activity took a much bigger hit than prices did. Homes sold for 96.2% of list price on average, and the median home sold in 51 days, which is actually two days faster than last September.
That's not a crash. It's a slower market where buyers have more options. Homes priced in line with current comparable sales are still attracting interest. If a listing isn't getting traction, price, presentation and the competing listings are the first three things to look at.
MONCTON: COLD
72 sales | $417,345 average | $399,450 median | 7.1 months of inventory | 53.5 days on market
Moncton slips from COOLING last month to COLD this month, and it took the steepest sales drop of the four main markets, down 38.5% from last September. New listings went the other way, up 19.5%, and active listings jumped 28.1% to 510.
A year ago Moncton was sitting at 3.4 months of inventory. It's now 7.1. That's more than double in twelve months. Median price still crept up 2.4%, even as sales fell. Sellers may need more patience and a closer look at their competition. Buyers have more time to compare.
Moncton North: COOLING
25 sales | $501,181 average | $442,500 median | 6.2 months of inventory | 49 days on market
Last month this was WARM at 3.4 months of inventory, and I said almost everything else was telling you to pump the brakes. The brakes got pumped. Sales fell 46.8% from last September, and months of inventory nearly doubled from 3.4 in August to 6.2 in September. That's supply measured against a slower selling pace, not twice as many homes for sale.
Average price jumped 7.4% to just over half a million while the median dropped 1.7%. The mix of homes that sold can change that math. A higher average doesn’t mean every house in the North End suddenly became more valuable. For pricing a particular home, recent comparable sales beat the neighbourhood average every time.
Moncton East: COLD
20 sales | $360,040 average | $326,000 median | 6.9 months of inventory | 60.5 days on market
Same 6.9 months of inventory as the region overall, so why COLD instead of COOLING? Selling time. Days on market went from 40 last September to 60.5 this September, the slowest of any rated area in Moncton.
Last month prices went up here and I said that didn't automatically mean a stronger market. This month average price fell 19.2% and median price fell 25.6%. Before anyone panics: 20 sales can swing an average like a screen door in a windstorm. The selling time is the number I'd watch.
Moncton Center: COLD
23 sales | $373,374 average | $338,000 median | 9.2 months of inventory | 45 days on market
Still the coldest rated sub-market in the region, although 9.2 months is an improvement on last month's 11.4. There are 212 active listings here, the most of any sub-market in Greater Moncton, and that's up 43.2% from a year ago.
If your home in Moncton Center has been listed for several months, it's worth reviewing pricing, presentation and competing listings together. A change in strategy can help a property stand out in a slower market. I explain the pricing side here: The Real Cost of Overpricing Your Home in Greater Moncton.
Moncton West: TOO SMALL TO RATE
Four sales. Six active listings. Two new listings all month.
That's not a market. That's a cul-de-sac with ambitions.
DIEPPE: COOLING
37 sales | $392,089 average | $395,000 median | 5.6 months of inventory | 56 days on market
Last month I said someone opened the freezer door in Dieppe. Somebody closed it. Months of inventory went from 8.5 in August to 5.6 in September, and Dieppe climbs from COLD back to COOLING.
Sales were still down 14.0% from last September, but that's the smallest drop of the four main markets. Median price rose 9.8%. The catch: homes took 56 days to sell compared with 37 last September. Homes are selling in Dieppe. Build a little extra time into the plan, whichever side of the deal you're on.
Dieppe Center: COOLING
13 sales | $384,800 average | $410,000 median | 4.9 months of inventory | 70 days on market
Inventory alone says balanced. Selling time and negotiation say otherwise. Days on market nearly doubled from 37 last September to 70 this September, and the sale-to-list ratio dropped to 95.4%.
Translation: buyers have room, and they're taking their time. Price it right and expect a negotiation anyway.
Dieppe Chartersville: BALANCED
14 sales | $407,421 average | $379,500 median | 5.2 months of inventory | 46.5 days on market
This is my favourite story of the month, and it's not because of the rating.
Last month Chartersville had six sales and 12.8 months of inventory. I said six sales wasn't enough to slap a label on, but 12.8 months was enough to make me pay attention. This month it sold 14 homes, double last September, and months of inventory dropped to 5.2.
That's exactly why I don't rate six-sale months. A scary number built on a tiny sample can disappear in thirty days. This one did.
Dieppe Fox Creek: TOO SMALL TO RATE
Seven sales.
Two months ago this was one of the hottest pockets in the region. This month sales fell 63.2% from last September, 66 homes are sitting active, and months of inventory hit 9.4 compared with 3.0 a year ago.
Seven sales isn't enough to rate. Same rule I just used to defend Chartersville. But if Fox Creek posts another month like this, it stops being a small sample and starts being a pattern.
Dieppe East: TOO SMALL TO RATE
Three sales. Six active listings.
Not a market. A carpool.
RIVERVIEW: COOLING
20 sales | $417,940 average | $379,000 median | 5.2 months of inventory | 32.5 days on market
Riverview slips from BALANCED to COOLING. Sales fell 25.9% from last September while new listings jumped 38.9%. Months of inventory went from 4.0 last month to 5.2.
But put it in context. Riverview is still the tightest of the four main markets by inventory, and at 32.5 days it's selling homes faster than any of them. Faster than last September too, when it was 42 days. Fewer sales, but the homes that did sell moved quickly.
Riverview West: BALANCED
10 sales | $383,990 average | $373,500 median | 4.6 months of inventory | 32 days on market
Exactly ten sales, the bare minimum I'll rate. Last month this was too small to rate. This month it's the tightest rated sub-market in the entire region.
That's partly Riverview West holding up and partly everybody else cooling off around it. Active listings did jump 53.3% from last September, so buyers here have noticeably more to choose from than they did a year ago.
Riverview East: TOO SMALL TO RATE
Eight sales. Last month this was the only HOT sub-market in the region.
On paper it's still tight: 2.3 months of inventory, only 18 active listings, and homes selling in 28.5 days. If you're selling here, inventory is still on your side. I'm just not putting a label on eight houses.
Riverview Center: TOO SMALL TO RATE
Two sales. Thirty-nine active listings. 19.5 months of inventory. 90.5 days on market.
The supply number deserves attention. Two sales don't make a trend. If you're buying or selling here, individual comparable properties will tell you far more than the area average.
SHEDIAC AND COAST: COLD
18 sales | $355,126 average | $364,900 median | 9.0 months of inventory | 34.5 days on market
Last month Shediac was the bright spot, one of the only areas that sold more homes than the year before. This month it sold 18, down 18.2% from last September, and drops from COOLING to COLD at 9.0 months of inventory.
Some context before anyone on the coast starts panicking. Last September was 8.1 months. Active listings are actually down 9.5% from a year ago. And homes that did sell went in 34.5 days compared with 83 days last September. The slowdown is in how many homes sold, while the homes that did sell moved faster than last September.
Shediac East / Cap-Pelé: TOO SMALL TO RATE
Seven sales.
The number I keep coming back to here is sale-to-list price. In August it came in below 94%. In September it was 91.1%.
Small sample, yes. But two months in a row, the homes that sold closed meaningfully below asking. That's worth knowing before you set a list price or write an offer on the coast.
RURAL GREATER MONCTON: MORE SPACE, DIFFERENT COSTS
This month I've added Rural Moncton, Rural Dieppe and Rural Riverview because buyers aren't stopping their search at the city limits. If more space, privacy and potentially lower property taxes are part of your next move, those markets deserve a place in this update too.
Rural doesn't automatically mean a lower tax bill. Compare the actual property's tax bill and applicable tax rates, not just the word "rural" in the listing. And compare the whole cost of living there: depending on the property, well and septic maintenance, commuting and snow removal belong in the calculation too.
The countryside has its perks. Unfortunately, the septic tank does not maintain itself out of gratitude.
For the tax side, the province explains how property tax works in New Brunswick. Keep in mind CREA's rural market areas are statistical boundaries, not property-tax jurisdictions.
Rural Moncton: TOO SMALL TO RATE
Three sales | $290,000 median | 35 active listings | 11.7 months of inventory
Only three homes sold, so I'm not building a price trend around them. There was plenty of supply relative to September's sales, but with three transactions, that number can swing a long way in either direction next month.
If you're buying here, look closely at what else is available in your price range. If you're selling, the properties buyers could choose instead of yours matter more than any regional average.
Rural Dieppe: TOO SMALL TO RATE
Nine sales | $325,000 median | 37 active listings | 4.1 months of inventory
Rural Dieppe came closest to earning a rating, with nine sales, matching last September. The homes that sold moved in a median of 28 days.
This was the most active of the three rural areas and had the lowest months of inventory. There is real activity here. Just not quite enough for me to bend the same 10-sale rule I've applied everywhere else. Same rule, every area, every month. That's what makes them comparable.
Rural Riverview: TOO SMALL TO RATE
Three sales | $315,000 median | 23 active listings | 7.7 months of inventory
Three sales again, matching last September. Active listings increased 43.8%, giving buyers more properties to consider than a year ago. The homes that sold took a median of 90 days, which is worth noticing, but three sales won't tell you how long yours will take.
For buyers and sellers alike, location, condition, access and the property's individual features need to lead the conversation. A rural market label covers a lot of ground. Literally.
REMEMBER THOSE SEMIS?
Last month I made a big deal out of semi-detached sales jumping 48.5% while detached sales fell.
September: 28 semi-detached sales. Down 42.9%.
Active semi listings are up 21.7% and semi inventory sits at 6.2 months compared with 2.9 a year ago. Same property type. Opposite direction. Thirty days apart.
I'm leaving that in on purpose, because it's the best argument I've got for not building a strategy around one month of anything. Including my own blog posts.
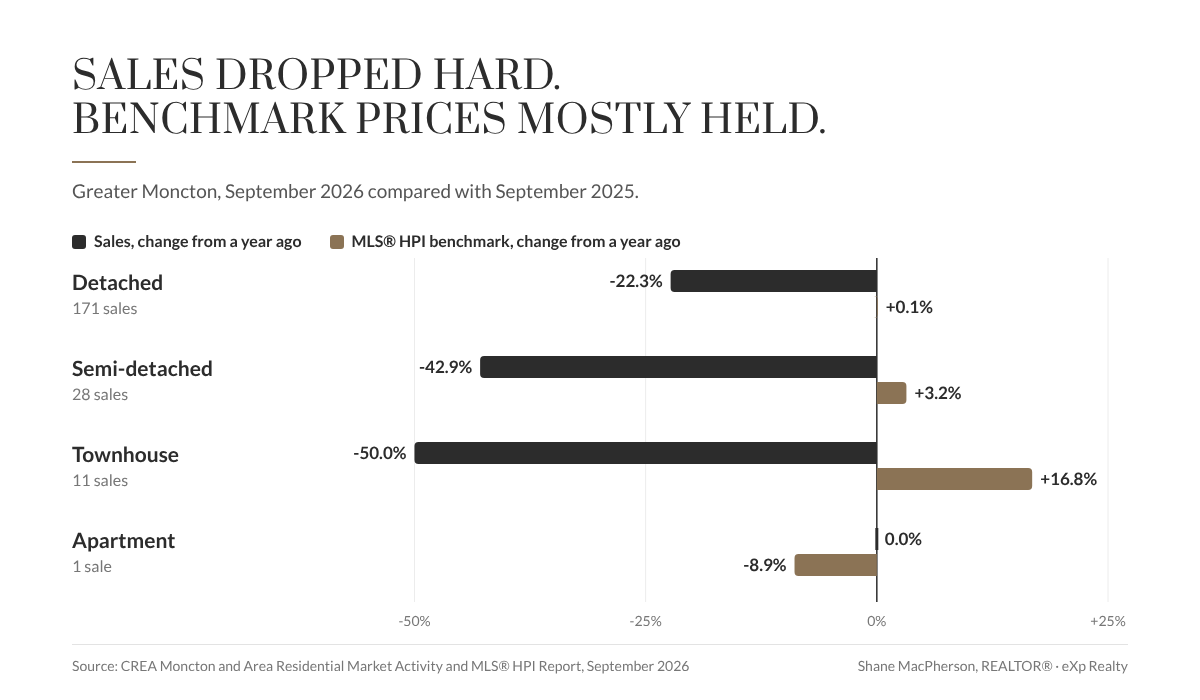
DETACHED HOMES TOOK THE PRICE HIT
171 detached homes sold in September, down 22.3%. Average detached price fell 7.0% and the median fell 5.8%, while the overall market median actually rose. If you're buying or selling a detached home, that's context the regional headline number would hide from you.
TOWNHOUSES ARE THE ODD ONE OUT
Only 11 townhouse sales, down 50%. But the MLS® HPI townhouse benchmark is up 16.8% from a year ago and 8.1% over the last three months, to $286,800. It's the only property type where the benchmark is clearly climbing, and it's also the cheapest benchmark on the board.
That doesn't make it a hot townhouse market. Inventory reached 6.6 months and the median sale price fell 7.4%. Benchmark and sales are different measures, and September shows why you need both.
APARTMENTS
One sale. Thirty-six active listings.
One sale isn't a trend. Individual comparable properties will tell you more here.
SO WHAT DOES SEPTEMBER ACTUALLY MEAN?
If you're selling, there are 1,575 active listings across the region and the fewest September sales in a decade. Your real competition is the homes a buyer would reasonably choose instead of yours. The homes that sold still went for an average of 96.2% of asking, and the regional median price rose slightly. A slower market makes pricing mistakes harder to recover from. Price, condition and presentation matter more when buyers have alternatives.
If you're buying, many parts of the region offer more leverage than they did during the tighter markets of recent years. More choice, more time, more room to negotiate on condition dates and price. And if you need to sell your current place before you can buy, a slower market changes how you should structure that move: buying a house when you have a house to sell.
And if you want to see how fast things can change, compare this to last month's Greater Moncton market update. Dieppe went from COLD to COOLING. Chartersville went from a scary number to a normal one. Riverview East went from HOT to unrated. Thirty days.
Which brings it back to the point. There isn't one Greater Moncton market. A seller in Riverview West is looking at 4.6 months of inventory. A seller in Moncton Center is looking at 9.2. Those are two different conversations. A useful buying or selling strategy has to reflect the neighbourhood, property type and price range you're actually working with.
CREA tracks the national numbers too if you want to see how Moncton and Area stacks up against the rest of the country: CREA Housing Market Stats
365 pages of CREA data. Fifteen sub-markets. The numbers, with the context attached.
If you want to know what page your house is on, call or text 506-852-6477.
Strong Roots - Smart Moves
Shane MacPherson | REALTOR® | eXp Realty | (506) 852-6477
Source: CREA Moncton and Area Residential Market Activity and MLS® HPI Report, September 2026. Ratings are my interpretation, not official CREA classifications. Sub-areas with fewer than 10 monthly sales are flagged rather than rated, because small samples make unreliable trends. Days on market are medians. Months of inventory measures how long current supply would last at the month's selling pace; it is not a forecast of how long any one home will take to sell. Percentage changes compare September 2026 with September 2025 unless otherwise noted. Month-over-month comparisons reference figures published in the August 2026 report, and CREA notes historical data can be revised.
