

ONE REGION. FOUR MAIN MARKETS. FIFTEEN LOCAL AREAS. AND A FEW DIFFERENT DIRECTIONS.
October gave Greater Moncton a little more activity. It did not give sellers permission to get carried away.
There were 251 residential sales across the Moncton and Area market, compared with 229 in September’s report. But sales were still down 23.2% from last October. Meanwhile, 501 new listings hit the market, the most for any October since at least 2016.
More sales than September. Fewer than last year. Plenty of competition still sitting on the market.
And the local picture? Moncton North moved back to BALANCED. Dieppe slipped back to COLD. Rural Moncton earned the only WARM rating among the areas covered here.
Nobody earned HOT. Again.
Here’s what those numbers actually mean, and where the regional headline misses the local story.
Jump to your area: Moncton | Dieppe | Riverview | Shediac | Rural Areas | Property Types
QUICK KEY BEFORE YOU SCROLL:
HOT: Sellers are firmly in control. Buyers need to come prepared.
WARM: Still favours sellers, but buyers can breathe.
BALANCED: Pretty much a fair fight.
COOLING: Buyers have more breathing room.
COLD: Buyers are holding more of the cards.
TOO SMALL TO RATE: Fewer than 10 sales. Enough to report. Not enough to hang a confident market label on.
Ratings weigh inventory, sales activity, selling time and sale-to-list ratios together. They’re my interpretation, not CREA classifications. Ten sales is my minimum for a rating, not a guarantee that the numbers suddenly stop being jumpy.
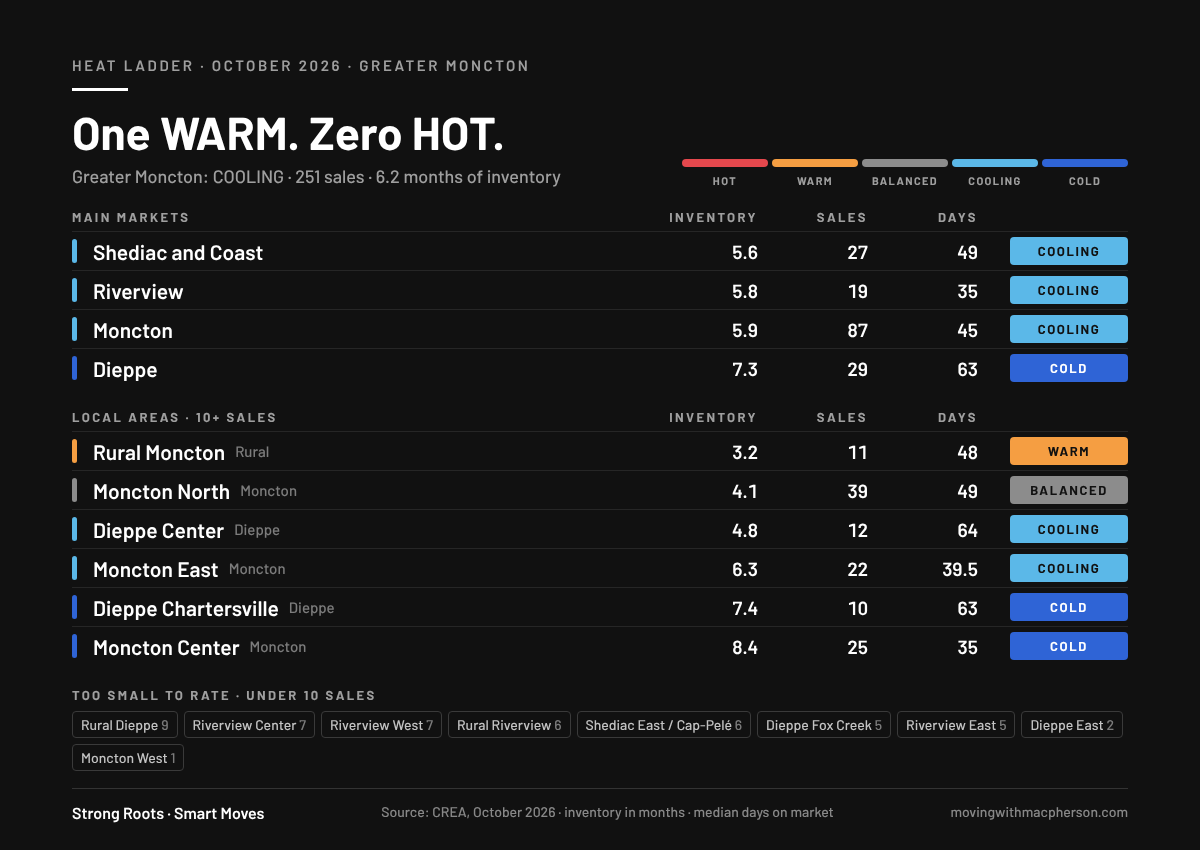
GREATER MONCTON: COOLING
251 sales | $372,862 average | $350,000 median | 6.2 months of inventory | 49 days on market
Sales were down 23.2% from last October, while active listings increased 9.9%. The report shows the fewest October sales since 2017 and the highest October months of inventory since 2018.
Compared with September’s report, sales increased and months of inventory eased from 6.9 to 6.2. Encouraging? Sure. Enough to announce a turnaround? Let’s give it more than thirty days. Seasonal changes and revisions can affect those comparisons.
Prices tell a more measured story than sales volume. The average fell 2.4% year over year, the median fell 2.8%, and the composite benchmark fell 0.5%. The benchmark was up 0.3% from September but remained down 5.9% over six months.
Homes that sold took a median of 49 days, compared with 39 a year earlier. Sellers received an average of 96.5% of list price. That is useful context for negotiations, although it does not come with a coupon for 3.5% off every listing.
Now zoom out. Through October, sales were down 9.7% from the same period last year, the average price was down 1.1%, and the median was unchanged at $360,000. October’s slowdown is real. So is the difference between one month and the year so far.
MONCTON: COOLING
87 sales | $370,630 average | $349,900 median | 5.9 months of inventory | 45 days on market
Moncton moves from COLD to COOLING in my assessment. Sales increased from September’s 72 to 87, and months of inventory eased from 7.1 to 5.9.
Against last October, the picture is still slower: sales fell 23.7%, active listings increased 26.2% to 511, and selling time stretched from 27.5 to 45 days. A stronger month than September does not erase the competition sellers are facing.
Moncton North: BALANCED
39 sales | $419,435 average | $370,000 median | 4.1 months of inventory | 49 days on market
The North End was one of the steadier areas. Sales were down just 2.5% year over year, and months of inventory eased from September’s 6.2 to 4.1.
The median price fell 12.9% year over year while the average fell 4.7%. The mix of homes sold can affect both numbers. Neither tells you that your house lost 12.9% of its value. That’s why I keep coming back to comparable sales. Your house needs to be compared with houses like yours, not whatever happened to sell across the entire North End.
Moncton East: COOLING
22 sales | $371,971 average | $339,950 median | 6.3 months of inventory | 39.5 days on market
Selling time improved from September’s 60.5 days to 39.5, while months of inventory eased from 6.9 to 6.3. That moves my rating from COLD to COOLING.
Sales were still down 37.1% from last October. The homes that sold moved faster than September’s sold homes, but there was still considerably less activity than a year ago.
Moncton Center: COLD
25 sales | $294,144 average | $286,250 median | 8.4 months of inventory | 35 days on market
There were 209 active listings, up 46.2% year over year. That gives buyers considerable choice relative to the monthly sales pace.
At the same time, the homes that sold took a median of 35 days. High inventory and relatively quick sales can coexist. The sold homes tell us what found a buyer; they do not tell us how long the remaining listings will sit.
If yours is one of them, review price, presentation and competing properties together. I cover the pricing side in The Real Cost of Overpricing Your Home in Greater Moncton.
Moncton West: TOO SMALL TO RATE
One sale. Six active listings.
I’m happy to discuss the six listings. I’m not building an entire market forecast around the one person who bought something.
DIEPPE: COLD
29 sales | $377,291 average | $350,000 median | 7.3 months of inventory | 63 days on market
Dieppe moves from COOLING back to COLD. Sales fell 29.3% year over year, and months of inventory increased from September’s 5.6 to 7.3. Selling time was the longest of the four main markets covered here.
The median price fell 12.5% from last October. Buyers have alternatives, and sellers need to know what those alternatives look like.
Dieppe has now gone COLD, COOLING, COLD across three monthly updates. That’s a good reason to watch the direction over time rather than treat one rating as a permanent diagnosis.
Dieppe Center: COOLING
12 sales | $371,471 average | $330,000 median | 4.8 months of inventory | 64 days on market
Supply relative to sales looks more balanced here than in the Dieppe market overall, but 64 days on market and a 96.2% sale-to-list ratio keep my assessment at COOLING.
The median fell 16.3% year over year, but selling time actually improved slightly from last October’s 67 days. Twelve sales, mixed signals. Enough to pay attention, not enough to pretend every number is telling the same story.
Dieppe Chartersville: COLD
10 sales | $419,200 average | $342,500 median | 7.4 months of inventory | 63 days on market
Chartersville moves from BALANCED to COLD. Active listings increased 60.9% year over year to 74, while sales fell 28.6%.
And here’s the part that makes headline shopping easy: the average price rose 12.7%, while the median fell 11.0%.
Pick whichever number supports your argument and you can make this sound like two different markets. With ten sales, I’d rather look at what actually sold.
Dieppe Fox Creek: TOO SMALL TO RATE
Five sales against 73 active listings produced 14.6 months of inventory. September’s figure was 9.4, and August’s was 5.5.
That sequence deserves attention. It still doesn’t make five sales a big sample.
If you’re listing here, pay close attention to the homes buyers can choose instead of yours. And no, 14.6 months of inventory does not mean your house is destined to sit for 14.6 months. It measures supply against the current selling pace.
Dieppe East: TOO SMALL TO RATE
Two sales. Seven active listings.
The useful conversation here is about the individual properties. Two transactions don’t need a dramatic headline.
RIVERVIEW: COOLING
19 sales | $407,278 average | $370,000 median | 5.8 months of inventory | 35 days on market
Sales fell 36.7% year over year, the largest decline among the four main markets covered here. Months of inventory edged up from September’s 5.2 to 5.8.
Yet the homes that sold had the shortest median selling time of those four markets, and the median price rose 9.6% year over year. Lower sales volume does not automatically mean every other measure gets worse too.
Riverview West: TOO SMALL TO RATE
Seven sales and 59 active listings produced 8.4 months of inventory. Active listings were up 90.3% year over year. The sales sample is small, but the increase in available competition is worth watching.
Riverview East: TOO SMALL TO RATE
Five sales, 4.4 months of inventory and a median selling time of 21 days. The average sale-to-list ratio was 91.5%. Quick sales and below-asking results appeared in the same small sample; neither is a promise about your property.
Riverview Center: TOO SMALL TO RATE
Seven sales and 29 active listings brought months of inventory to 4.1, compared with September’s 19.5. Both a higher sales count and fewer active listings contributed. This is why a dramatic ratio based on two sales needs a very large asterisk.
SHEDIAC AND COAST: COOLING
27 sales | $418,896 average | $422,500 median | 5.6 months of inventory | 49 days on market
Using CREA’s Shediac Area figures here, Shediac moves from COLD to COOLING, with sales increasing from September’s 18 to 27 and months of inventory easing from 9.0 to 5.6.
Sales were still down 18.2% year over year, but active listings were also down 7.9%. The median price rose 3.0%, while the average fell 16.1%. That is another reason to look beyond a single price statistic.
Shediac East / Cap-Pelé: TOO SMALL TO RATE
Six sales, up from five last October. The sale-to-list ratio was 99.2%, compared with September’s 91.1%. Small samples can swing in either direction. This area is presented separately from the Shediac Area figures above.
RURAL GREATER MONCTON: THE TIGHTER SIDE OF THE MARKET
26 sales | $473,588 average | $427,450 median | 3.4 months of inventory | 46.5 days on market
CREA’s combined Rural Routes Moncton category, covering Rural Moncton, Rural Dieppe and Rural Riverview, recorded 26 sales versus 25 last October. That is a 4.0% increase, while each of the four main markets above recorded fewer sales.
The combined rural median was higher than any of those four markets. Rural does not automatically mean cheaper. Compare the actual property, tax bill, well and septic requirements, commute and snow removal costs.
A little more space is lovely. Unfortunately, the driveway doesn’t plow itself.
Rural Moncton: WARM
11 sales | $515,445 average | $460,000 median | 3.2 months of inventory | 48 days on market
Rural Moncton earned my only WARM rating among the local areas covered here. Sales increased from six last October to 11, active listings fell 28.6% to 35, and median selling time shortened from 82 to 48 days.
There is some support beyond October: year-to-date sales were up 6.6%, with year-to-date months of inventory at 3.9 versus 4.6 a year earlier. The year-to-date median price, however, was down 4.1%.
So yes, a comparatively tighter market. No, that does not mean every rural property is suddenly worth more.
Rural Dieppe: TOO SMALL TO RATE
Nine sales, 3.4 months of inventory and 27 median days on market. There was activity, but the average sale-to-list ratio was 93.4%, and sales were down 10.0% year over year. Tight-looking supply does not eliminate negotiation.
Rural Riverview: TOO SMALL TO RATE
Six sales and 22 active listings produced 3.7 months of inventory. The median price was $487,500, the highest of the three rural areas, but six transactions are not enough to build a pricing strategy around that ranking.
THE SEMIS ARE KEEPING US HUMBLE
August: semi-detached sales up 48.5% year over year.
September: down 42.9%.
October: up 9.1%, with 36 sales.
Up, down, up. All compared with the same month a year earlier. This is why one month of data should start a conversation, not finish it.
And October’s higher sales count comes with a catch: the median price fell 6.8% to $349,500, while active listings increased 20.4%. More sales did not mean less competition or a higher median price.
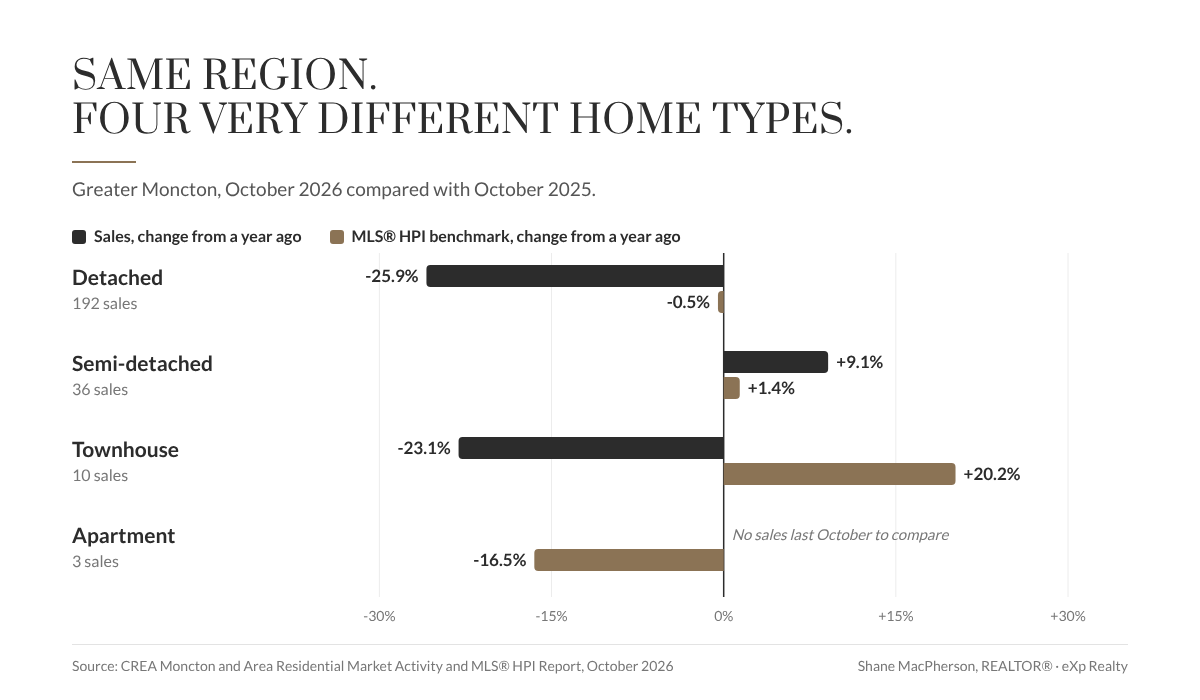
Price changes in this chart refer to MLS® HPI benchmark prices, which differ from the median sale prices discussed in the text.
DETACHED HOMES: FEWER SALES, A STEADIER MEDIAN
192 detached homes sold in October, down 25.9% from last October. The median price rose 0.9% to $363,250, while the average fell 2.4%.
Sales activity took a much bigger hit than the median price. If you’re selling a detached home, that’s useful context. It still leaves plenty of room for differences between locations, price ranges and individual properties.
TOWNHOUSES: BENCHMARK UP, SALES DOWN
Ten sales, down 23.1% year over year, with 9.0 months of inventory. The median sale price fell 7.4% to $310,000.
Meanwhile, the MLS® HPI townhouse benchmark rose 20.2% to $289,000.
The benchmark tracks the price of a typical home using its characteristics. The median is the midpoint of the homes that actually sold. Different measures, different results. A rising benchmark doesn’t make nine months of inventory disappear.
APARTMENTS: A NUMBER WORTH WATCHING
Three sales. Thirty-five active listings.
The apartment HPI benchmark was $274,500, down 16.5% year over year and 12.0% from September. It was also below the townhouse benchmark this month.
That’s a substantial reported change, but it doesn’t tell you that every condo lost 12% of its value in thirty days. The benchmark is separate from the average or median of those three sales. If you’re selling a condo, comparable units in your building and similar developments matter much more than applying that percentage straight to your asking price.
SO WHAT DOES OCTOBER ACTUALLY MEAN?
If you’re selling, buyers have alternatives. Your competition is the set of homes they could reasonably choose instead of yours, not every listing across the region. Price, condition and presentation need to make sense together. Hope is a lovely thing. It is not a pricing strategy.
If you’re buying, several areas offer more choice relative to sales than they did a year ago. That can create room to negotiate price, timing and conditions. It does not mean every seller will accept a deep discount, especially where the right type of property is scarce.
If you need to sell before you buy, work out that sequence early. I cover the options in Buying a House When You Have a House to Sell.
A seller in Rural Moncton is looking at 3.2 months of inventory. A seller in Moncton Center is looking at 8.4. The regional headline is useful background. Your neighbourhood, property type, price range and competition determine the practical conversation.
You can also compare my previous market updates or explore CREA’s housing market statistics.
365 pages of CREA data. Fifteen local areas. The numbers, with the context attached.
If you want to know what they mean for your house, your neighbourhood and your next move, call or text 506-852-6477.
Strong Roots - Smart Moves
Shane MacPherson | REALTOR® | eXp Realty | (506) 852-6477
Coverage: The four main markets and 15 local areas discussed here are selected parts of CREA’s broader Moncton and Area region, not an exhaustive breakdown of its sales. CREA reporting areas do not necessarily follow municipal boundaries. Shediac East / Cap-Pelé is reported separately from Shediac Area.
Source: CREA, Moncton and Area Residential Market Activity and MLS® Home Price Index Report, October 2026. Percentage changes compare October 2026 with October 2025 unless otherwise stated. Year-to-date comparisons cover January through October. September and August comparisons use figures published in my previous updates, not a verified revised monthly series; CREA cautions that historical figures can be revised. Monthly activity figures are not seasonally adjusted. Days on market are medians for completed sales. Months of inventory is active listings divided by monthly sales, not a forecast of a particular home’s selling time. Ratings are my interpretation, not official CREA classifications; fewer than 10 monthly sales are left unrated, and even rated areas can have volatile results.

Comments:
Post Your Comment: